Costs of measuring SOC
The cost of measuring SOC largely depends on the number of samples, field accessibility, and laboratory analysis.
The number of samples to be taken in a project depends
on the level of variability in soil organic carbon in the target area, the
required levels of precision and resource availability. Soil often has greater spatial variability that demands
more sampling efforts. In some cases the cost of demonstrating the change in
carbon stocks in soils to the required accuracy and precision may exceed the
benefits that accrue from the increase in stocks (IPCC,
2003; MacDicken, 1997). Therefore developing locally calibrated
models that can use easily collected data can minimize the cost of
demonstrating a change in soil organic carbon stock (IPCC, 2003). Thus,
developing alternative cheaper and repeatable measures is a research priority.
Infrared spectroscopy offers promise for a rapid,
reliable and cost effective measurement of soil organic carbon. In this study
we compared the cost of measuring SOC analyses using the conventional Thermal
Scientific FlashEA 1112 CN analyzer, a commercial laboratory in the UK, and
near-infrared spectroscopy. All costs are based on conducting sampling and
analysis in Kenya.
The total costs of measuring cabon using the Thermal
Scientific FlashEA 1112 CN analyzer is USD 20.77 per soil sample, of which 87%
are personnel costs (Figure 1b). If
acidification is applied to remove carbonates from the sample, the price will
increase to USD 25.76. Soil sampling constitutes the highest proportion of the
costs of carbon measurement.
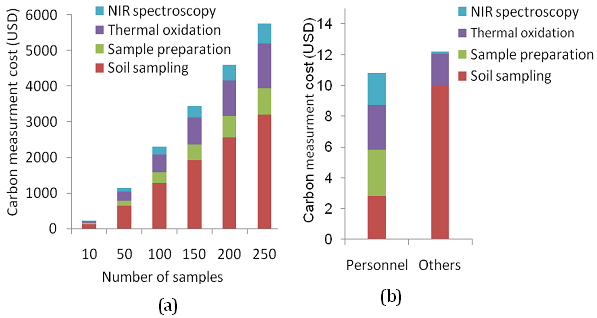
Figure 1. Cost of measuring SOC
stocks: (a) costs and (b) cost structure of measuring one soil sample. The
personnel costs are more or less uniform for the four major activities, while
soil sampling constitutes a large proportion of the other costs.
The
laboratory costs (without field sampling and sample preparation costs) of
measuring carbon using the conventional thermal oxidation and NIR soil
spectroscopy are USD 4.99 and 2.19 per sample, respectively. Compared to the
thermal oxidation method, soil spectroscopy can reduce laboratory costs of
measuring carbon by 56% (Figure 2a).
However, there is no significant difference in the total cost of measuring SOC
between the Thermal Scientific FlashEA 1112 CN analyzer and the NIR soil
spectroscopy when a small number of soil samples are used (Figure 2b). This is
because a large proportion of the costs of soil carbon measurement are incurred
for soil sampling and preparation compared with laboratory costs (Figure 2a).
With increasing number of soil samples, however, the total cost of carbon
measurement using NIR spectroscopy is cheaper than using the Thermal Scientific
FlashEA 1112 CN analyzer (Figure 2b). Compared to costs of other commercial
soil labs, the cost of measuring SOC using the NIR spectroscopy is
significantly cheaper than commercial soil laboratories charges (Figure 7.2c,
d). However the big advantage of IR technology is the high throughput
achievable, which is critical for carbon inventories at project level or larger
geographical extents. The daily throughputs of a thermal analyser
is quite low (30 samples acidified, or 60 samples unacidifed)
whereas NIR throughput is 350 samples per day, and over 1000 per day with
robotic MIR systems (Shepherd & Walsh, 2007). Thus throughput rate is the
critical determining factor.
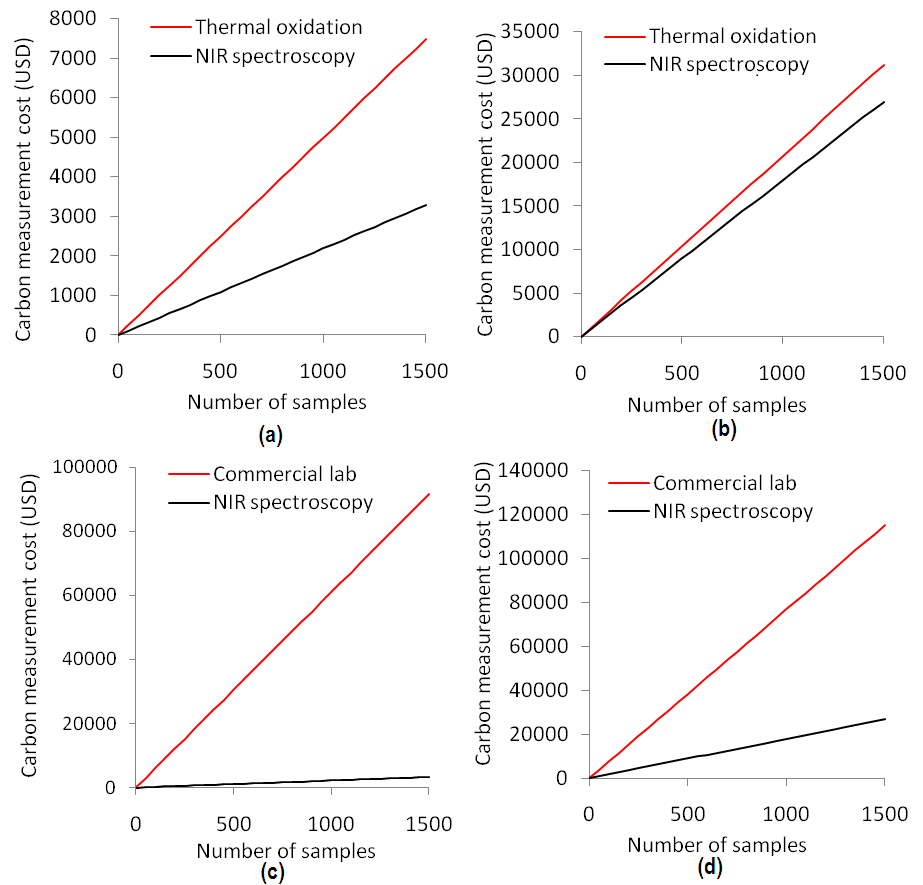
Figure 2. Comparisons of costs of
measuring SOC carbon: (a) laboratory and (b) total costs of measuring SOC using
the Thermal Scientific FlashEA 1112 CN analyzer and NIR soil spectroscopy. Both
the (c) laboratory and (d) total costs of measuring SOC using NIR spectroscopy
is significantly cheaper than the costs of measuring it in commercial soil labs.
Cost-error analysis
According to the Marrakesh
Accords, uncertainties in measuring greenhouse gases in offsetting projects
should be quantified. Estimation errors, model errors, and sampling errors
associated with the number of samples are among the major sources of
uncertainties in measuring SOC. IPCC (2003) has recommended using confidence
intervals as quantitative estimate of uncertainty.
To estimate the sample size
required to measure carbon stocks with the desired confidence interval (95%),
we used the mean (21.53 t C ha-1) and standard deviation (13.62 t C ha-1) of
carbon stocks in the top soil (20 cm) of the five sites in the western Kenya (Figure
3).
To decrease the confidence
interval from 4.03 to 2.02 t C ha-1, the sample size should increase from 50 to
200 (Figure 3a). The increase in the number of samples from 50 to 150 in turn
increases the cost of carbon measurement by USD 3115 (Figure 3b).
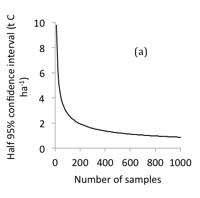
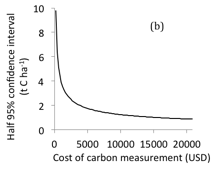
Figure 3. (a)
95% confidence intervals (t C ha-1) of the carbon stock and (b) the measuring
cost of carbon in the topsoil layer (0-20 cm) from 160 plots in western Kenya.
__________
IPCC. 2003. Good Practice
Guidance for Land Use, Land-Use Change and Forestry, In Penman, J., et al.,
eds. Institute for Global Environmental Strategies (IGES), Japan.
MacDicken,
K.G. 1997. A Guide to Monitoring Carbon Storage in Forestry
and Agroforestry Projects. Winrock International, Arlington, Virginia.
Shepherd, K.D., & Walsh, M.G.
2007. Infrared spectroscopy-enabling
an evidence-based diagnostic surveillance approach to agricultural and
environmental management in developing countries. Journal of
Near Infrared Spectroscopy 15:1-19.